Wide Events: cutting 80% of log volume and improving observability
One flow, 48 log lines, and what changes when you stop logging steps and start logging stages.
A system can produce hundreds of log lines to tell the story of a single request.
That is not carelessness — it is the default. An authorization, for example, crosses several services; each one contributes dozens of lines; across the whole path it adds up to hundreds. The first thing that costs you is money. The second, and the expensive one, is that nobody can read it.
And when the volume starts to hurt, the usual way out is dropping logs, sampling, or cutting retention — three different ways of throwing information away.
At that point the easy answer is sitting right there, cheap enough to approve without a meeting: raise the ingestion limit, extend retention, move on with the sprint. Every team has made that call, and most of the time it is the correct call.
And then comes the annoying question — the one that explains why another path is worth taking:
Are we solving this, or are we paying to avoid solving it?
Answering it means counting first.
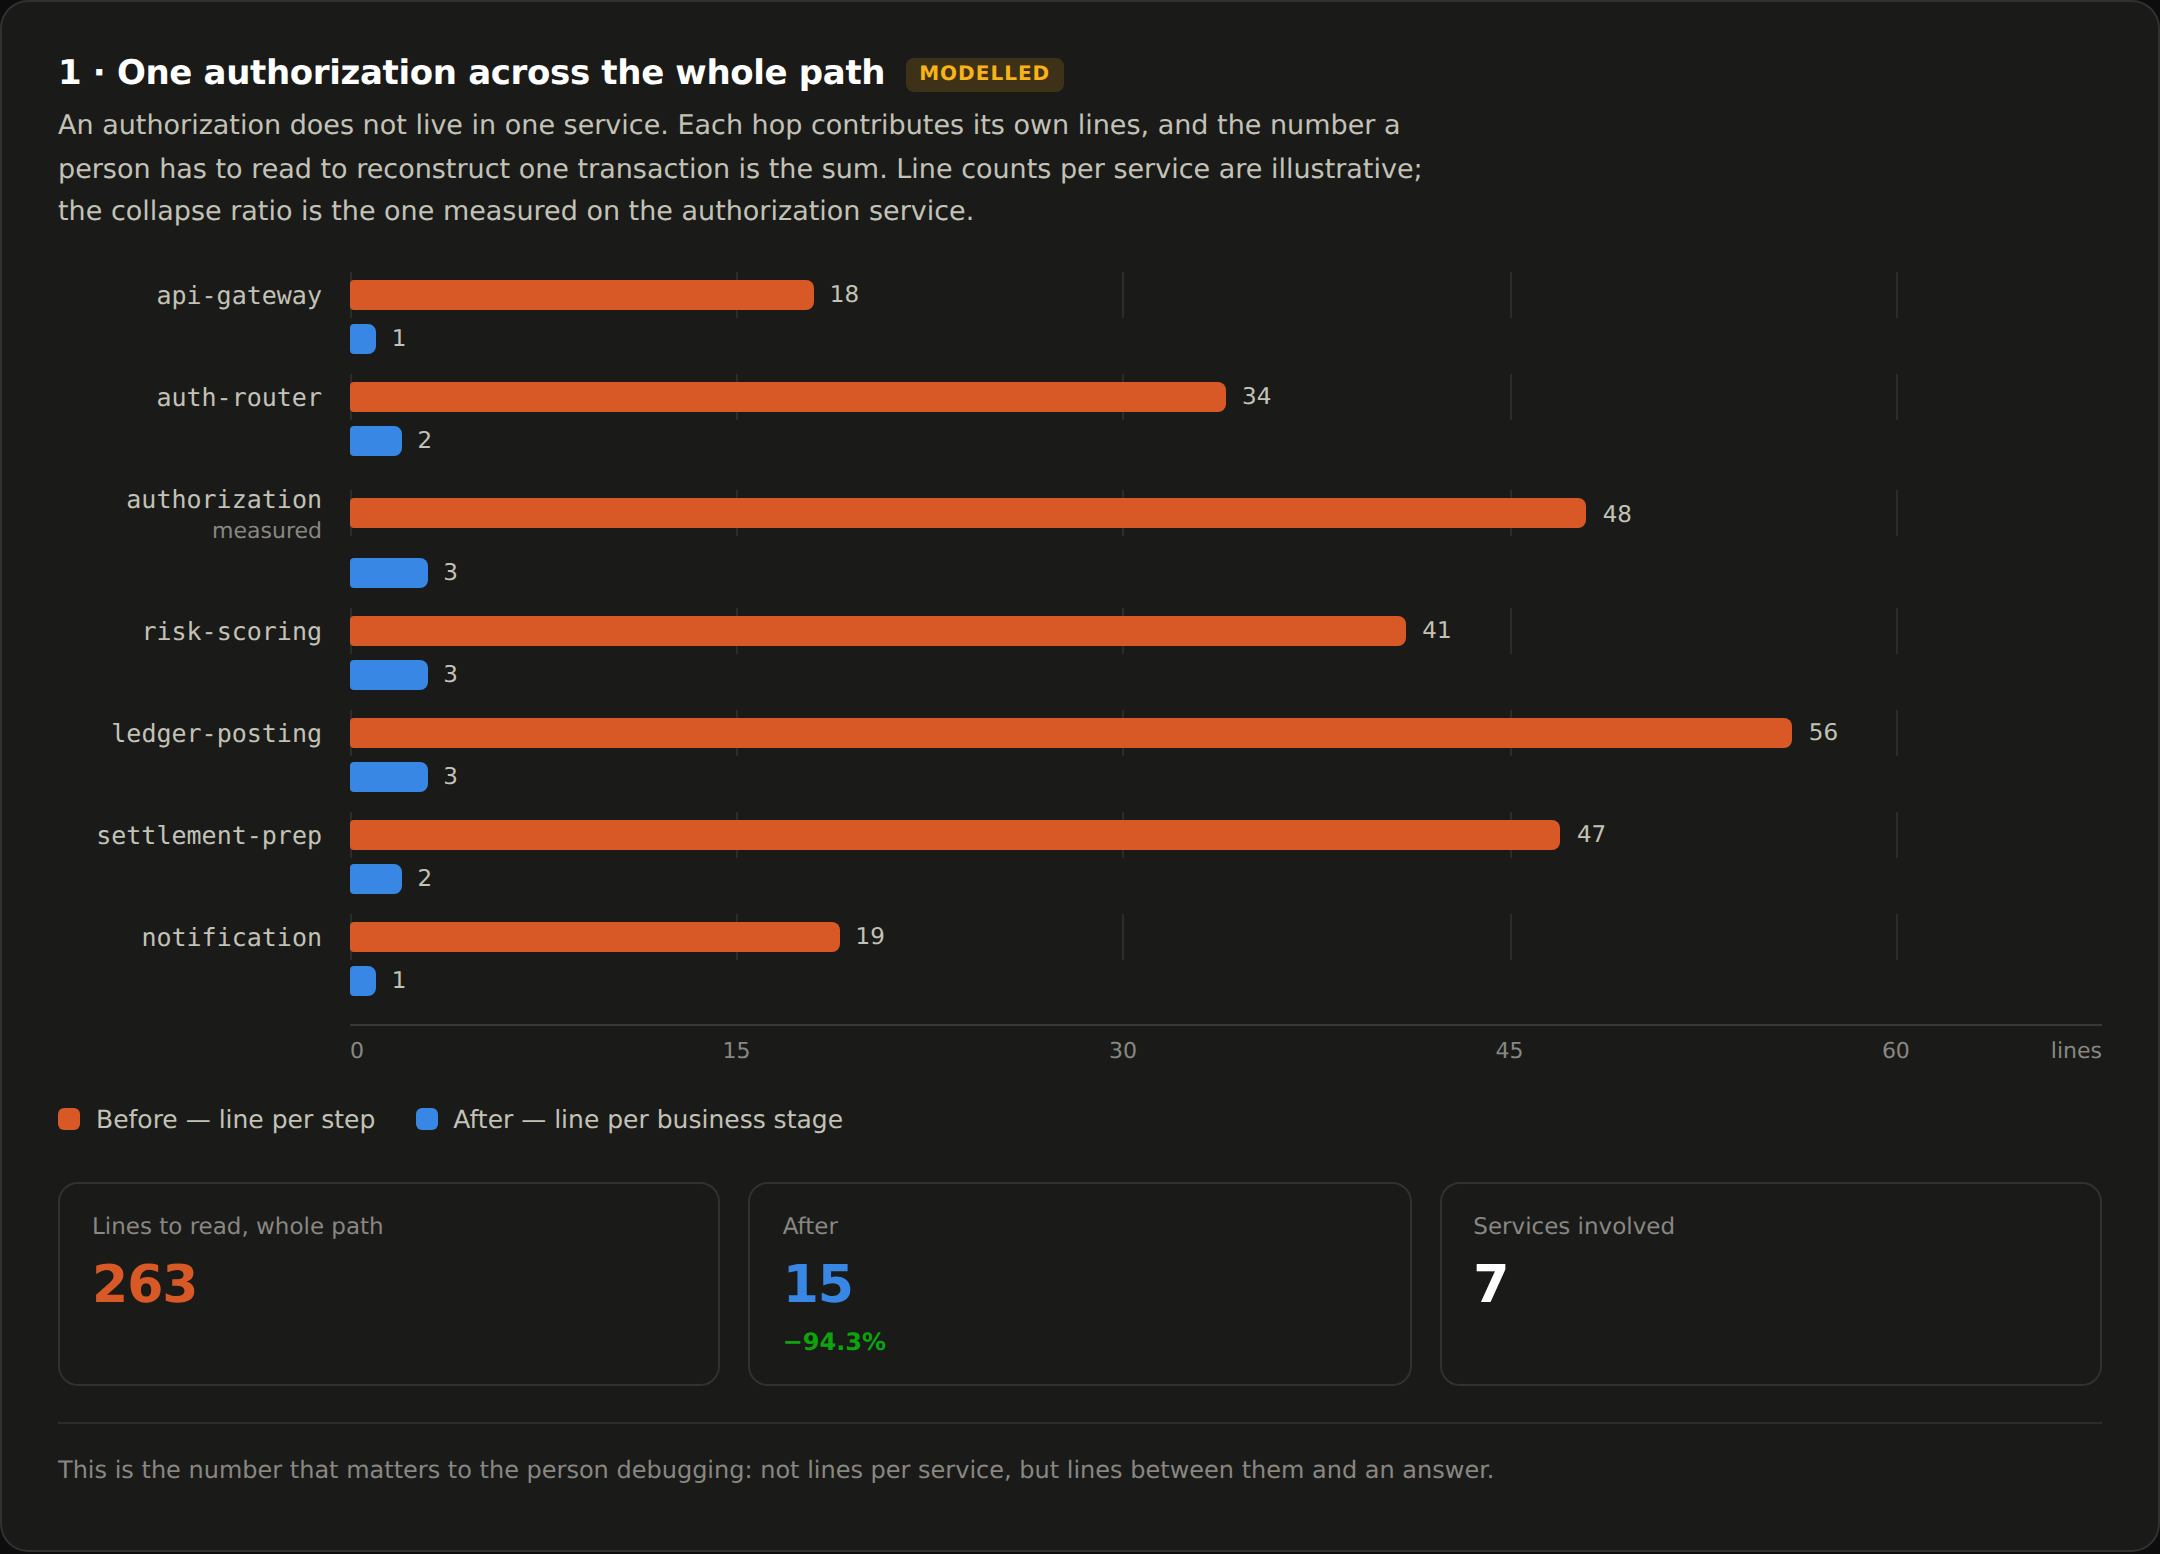
1. What the count looks like
Take one flow inside a single authorization service — not the whole path, just one service. 48 log lines, produced by 14 different loggers, for a flow that finished in 75 milliseconds.
Every one of those lines is true. Not one of them is useful on its own:
[IntegrityLocker] Locking consumer
[HttpClient] Send POST https://fake-url.com/v1/receivables
[HttpClient] Receive response 200
[HttpClient] Send POST https://antifraud/v1/authorize
[HttpClient] Receive response 200
[Auth::UseCase] Validating responses
[Auth::UseCase] Processing authorization
[IntegrityLocker] Release integrity locker
[Server] Response built
To understand a single transaction, someone filters by correlation id, sorts by timestamp, reads 48 rows, and subtracts timestamps by hand to work out where the time went.
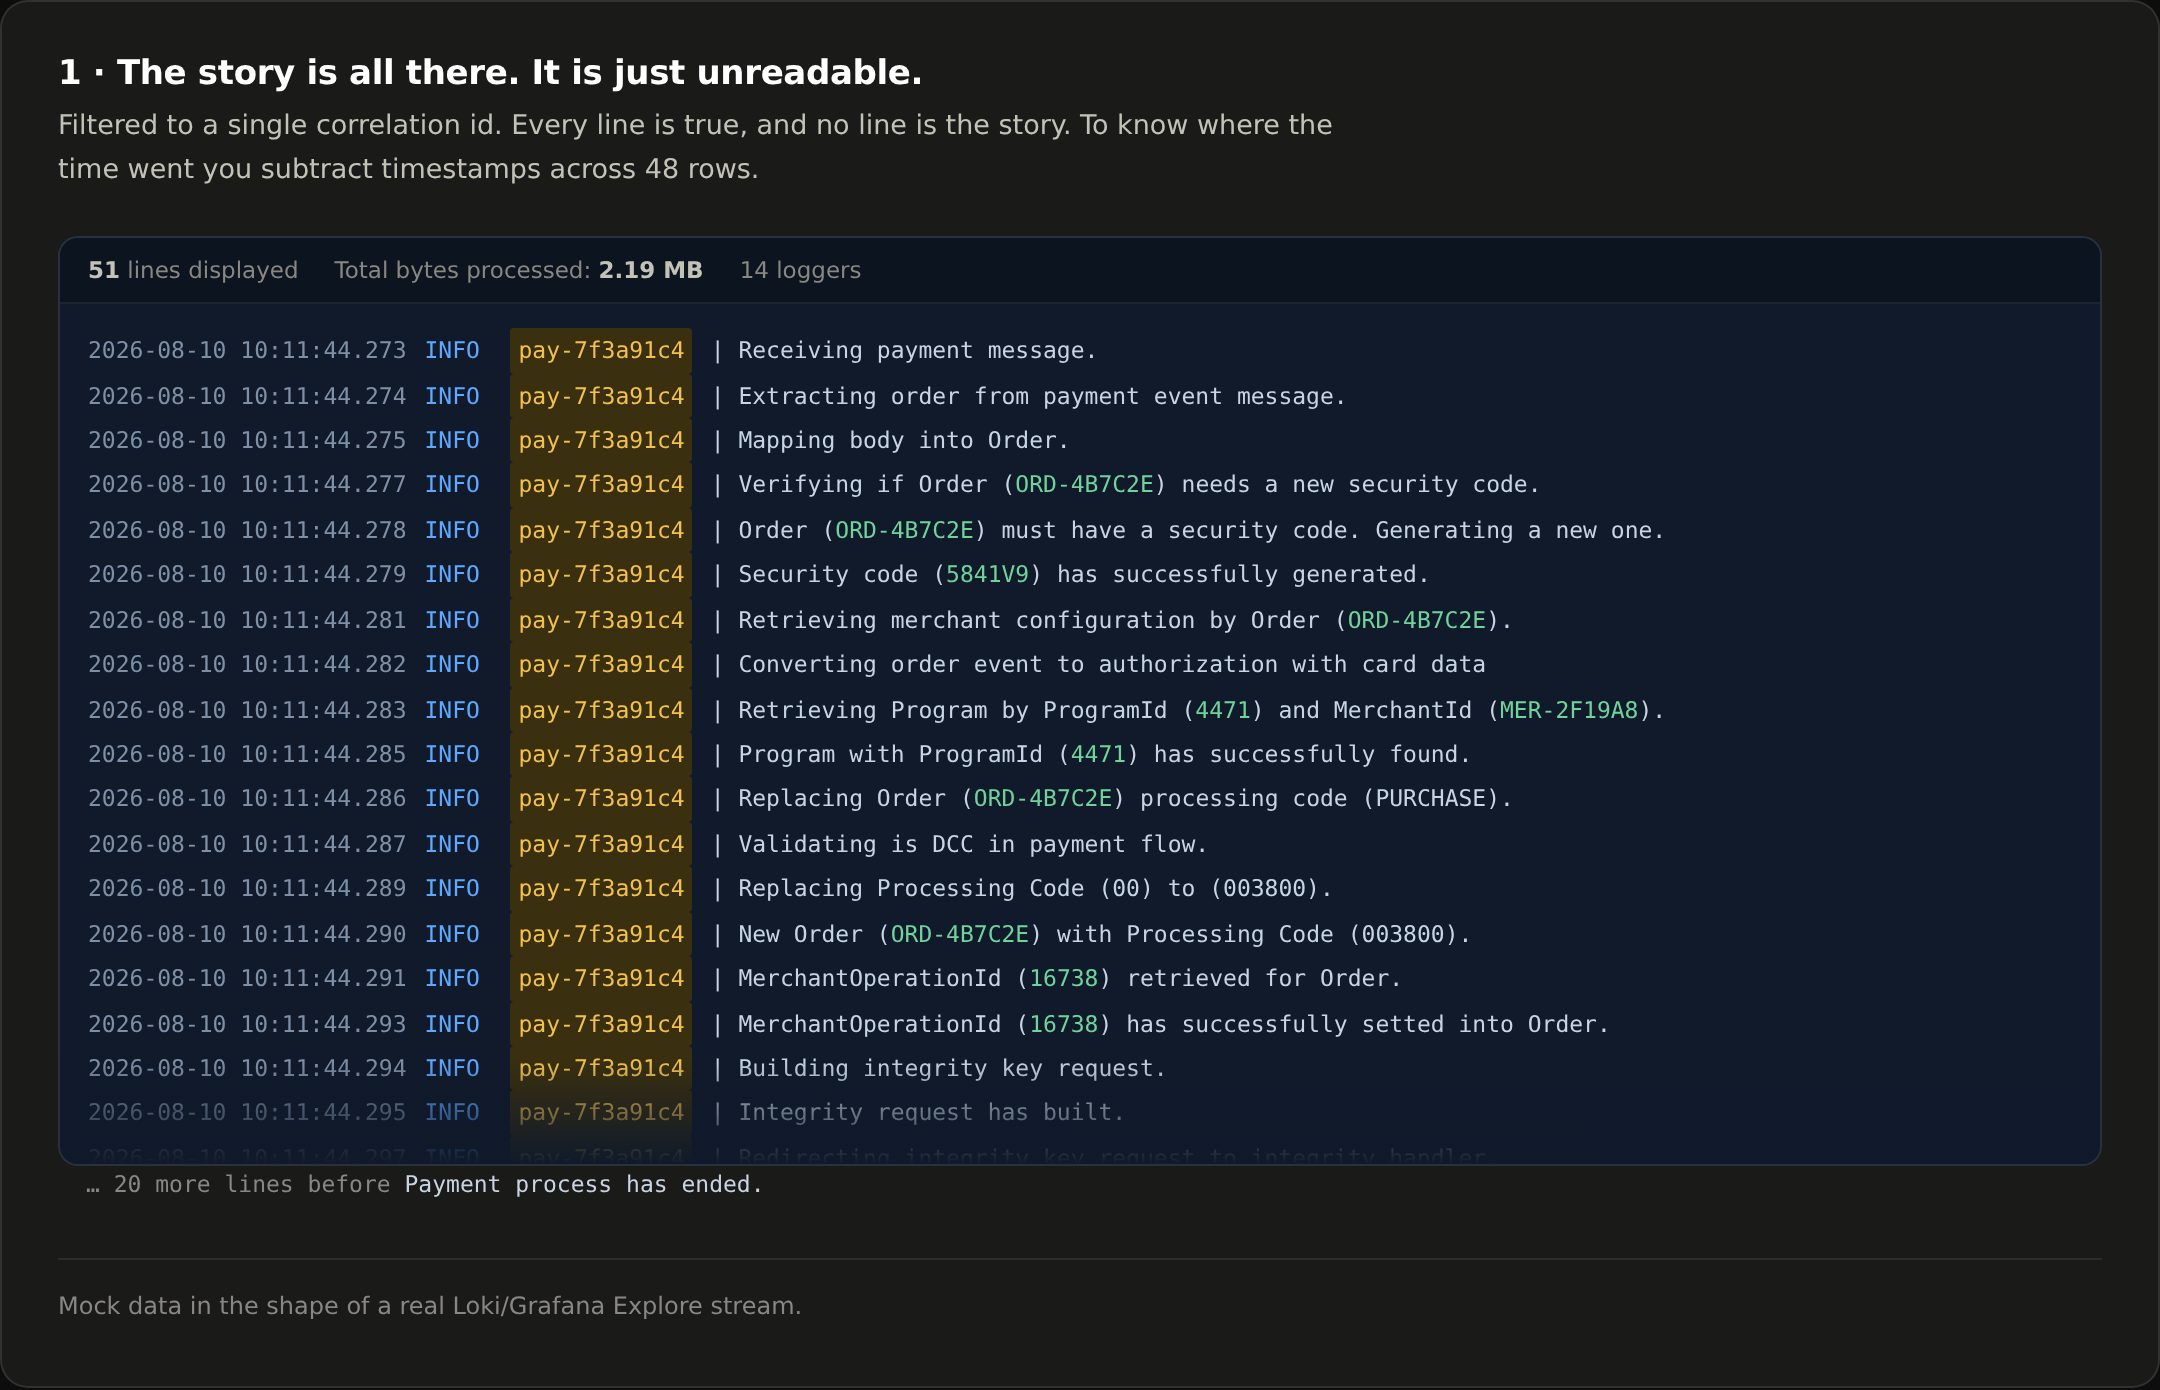
And it is worth stopping here: nobody decided to log 48 times. Each line was added for a good reason, by a competent person, in a different pull request, over several years. Nobody was careless. The volume was not designed — it accumulated. That is true of almost every logging problem I have seen, and it is why "just log less" is useless advice. Log less where? Every line has an author who had a reason.
2. Where the volume actually comes from
Here is the trick.
Before changing anything, we need to look at what a log line is actually made of:
2026-08-10 10:11:44.443  INFO  [pay-7f3a91c4…2311]  AntifraudEvaluationService
[event-loop-thread-5]  pod=payments-api-6d9f4c7b85-x2knq  svc=payments-api  ver=v2.14.3
az=sa-east-1a  OrderId=ORD-4B7C2E  AuthorizationId=AUTH-8D31C2  MerchantId=MER-2F19A8
│ Performing antifraud evaluation.
Everything before the │ is the stamp. Everything after it is what happened.
The stamp is charged once per line, and it is identical on every line carrying the same correlation id. To tell one story, you pay for it 48 times. That is where the volume comes from: not from what you are recording, but from how many times you record the context around it.
A precision note, because this is where the argument tends to get overstated and the author
gets corrected in the comments: in a system like Loki, stream labels — cluster,
namespace, region, job — are indexed once per stream, not once per line. In those
specific fields, collapsing lines saves nothing. What actually shrinks is:
- the per-line stamp — timestamp, severity, logger name, thread, pod, service version, availability zone;
- the business identifiers repeated inside every payload;
- the bytes your queries have to scan, which is a real and separately billed cost.
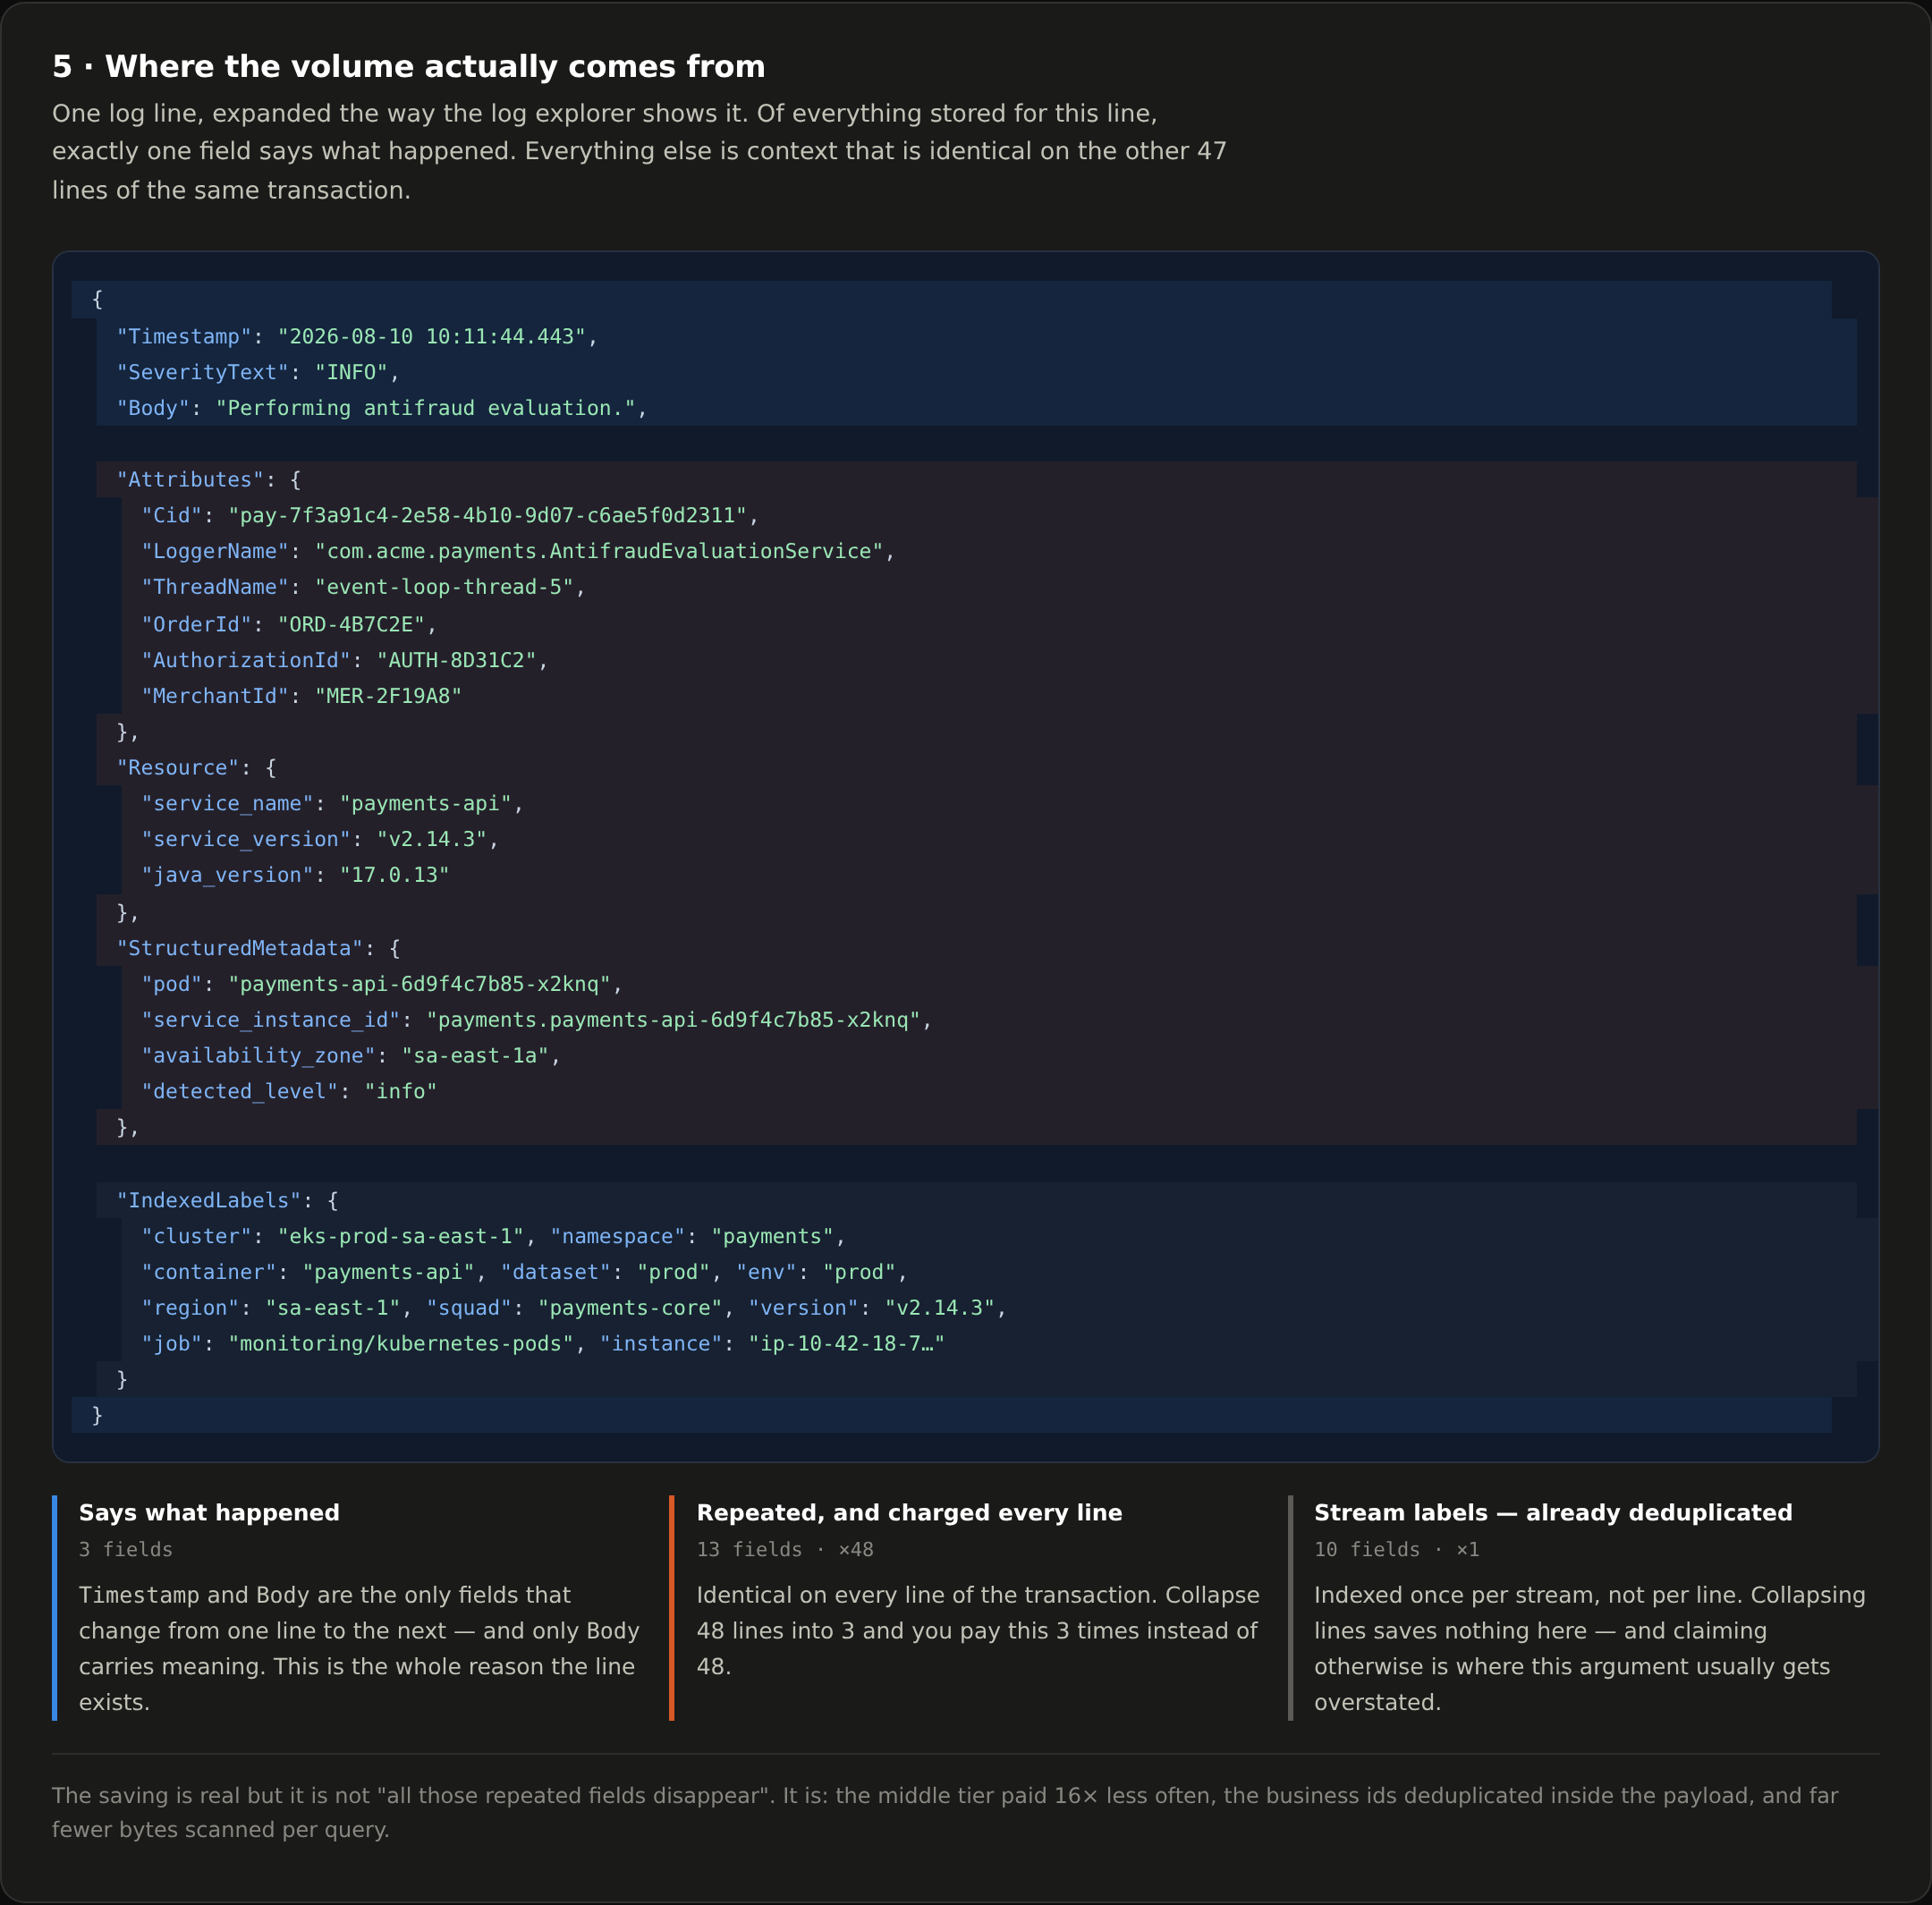
This is where wide events shine: they cut lines without losing the stream of events that actually happened. Cut the lines by 16×, and you cut the stamp by 16× — without losing what matters.
3. A log is not a record. It is a narrative.
We had been treating logs as an execution transcript, a faithful record of every step the program took. By that standard, 48 lines is a success. Nothing is missing.
But nobody reads a transcript. When someone opens a log at 3 a.m., they are not auditing execution. They are asking a story question: what happened to this transaction, in what order, and where did it go wrong?
Completeness and legibility are not the same property. We had maximised one and never measured the other.
And a narrative reads better summarised — with the detail available the moment you want it. That is not a compromise. That is how every other form of written information works.
4. The accumulator
Instead of writing a line at every step, you keep an accumulator in the request scope. Each step appends an event. At the checkpoints that mean something in the flow, you flush.
on request start:
  ctx.events  = []
  ctx.started = now()
  ctx.cid     = correlationFrom(request)

# replaces log.info("Performing antifraud evaluation.", attrs)
ctx.addEvent("Performing antifraud evaluation.", attrs)

# implementation of the method that replaces log.info
addEvent(description, attrs = {}, level = INFO) {
  this.events.append({
      Description: description,
      OffsetMs:    now() - this.started,
      Attributes:  attrs,
      Level:       level
  })
}

# at each checkpoint
flush(description, attrs = {}) {
  events = this.flushEvents()
  level  = greaterSeverity(events)
  attrs  = attrs << [
    EventCount: sizeOf(events),
    Events:     events
  ]

  log.onSeverity(this.cid, level, {
      Body:  description,
      Attrs: attrs
  })
}
Three design decisions carry most of the value:
Checkpoints cut disjoint slices. ctx.events is emptied on every flush. No event appears
in two lines, and losing one line costs you exactly that slice of the flow rather than the
whole story. This matters when the problem you started with was log loss.
OffsetMs is measured from the start of the flow, not between steps. Offsets from a
single origin stay meaningful even if a line goes missing; deltas between adjacent steps do
not.
The message text does not change. We passed the original strings through verbatim into
Description. Every existing query, alert and dashboard that matched on message text kept
working throughout the rollout. That is the difference between a change you can ship
incrementally and one that needs a coordinated switchover.
5. What earns an event
Collapsing 48 lines into 3 is mechanical. It is also the smaller half of the win — if you stop there, you compressed the noise instead of removing it.
The real question the accumulator forces you to answer is one that line-by-line logging lets you avoid forever: what actually deserves to be recorded?
When every log statement is its own line, adding one is free and nobody reviews it. When events accumulate into a payload you will read as a single narrative, a useless event is visibly useless — it sits there in the array, in front of you, adding nothing.
What we kept:
- Decision points. Anywhere the flow could have gone another way. "the order needs a new security code" earns an event; the fact that one was then generated does not need a second.
- Boundaries. Calls out to another service, the database, a cache, a queue. That is where time and failures come from.
- State changes with audit value. The things a dispute or a regulator will ask about later. In payments, that is most of the point.
- Values that changed. Replacing a processing code, resolving a merchant id — record the result, not the intention to do it.
What we dropped:
- Paired intention/completion lines.
Building integrity key request.followed byIntegrity request has built.is one event, not two — unless the gap between them is something you would ever measure. - Method entry and exit.
Receiving payment message.tells you the handler you are already looking at is running. - Restatements.
Account was successfully found.immediately afterRetrieving Account.
A rough test that held up well: if this event were missing from the narrative, would I notice, and would I be worse off? If the answer is no, it was never observability — it was a debug log someone left themselves while writing the code, and it has been billed monthly ever since.
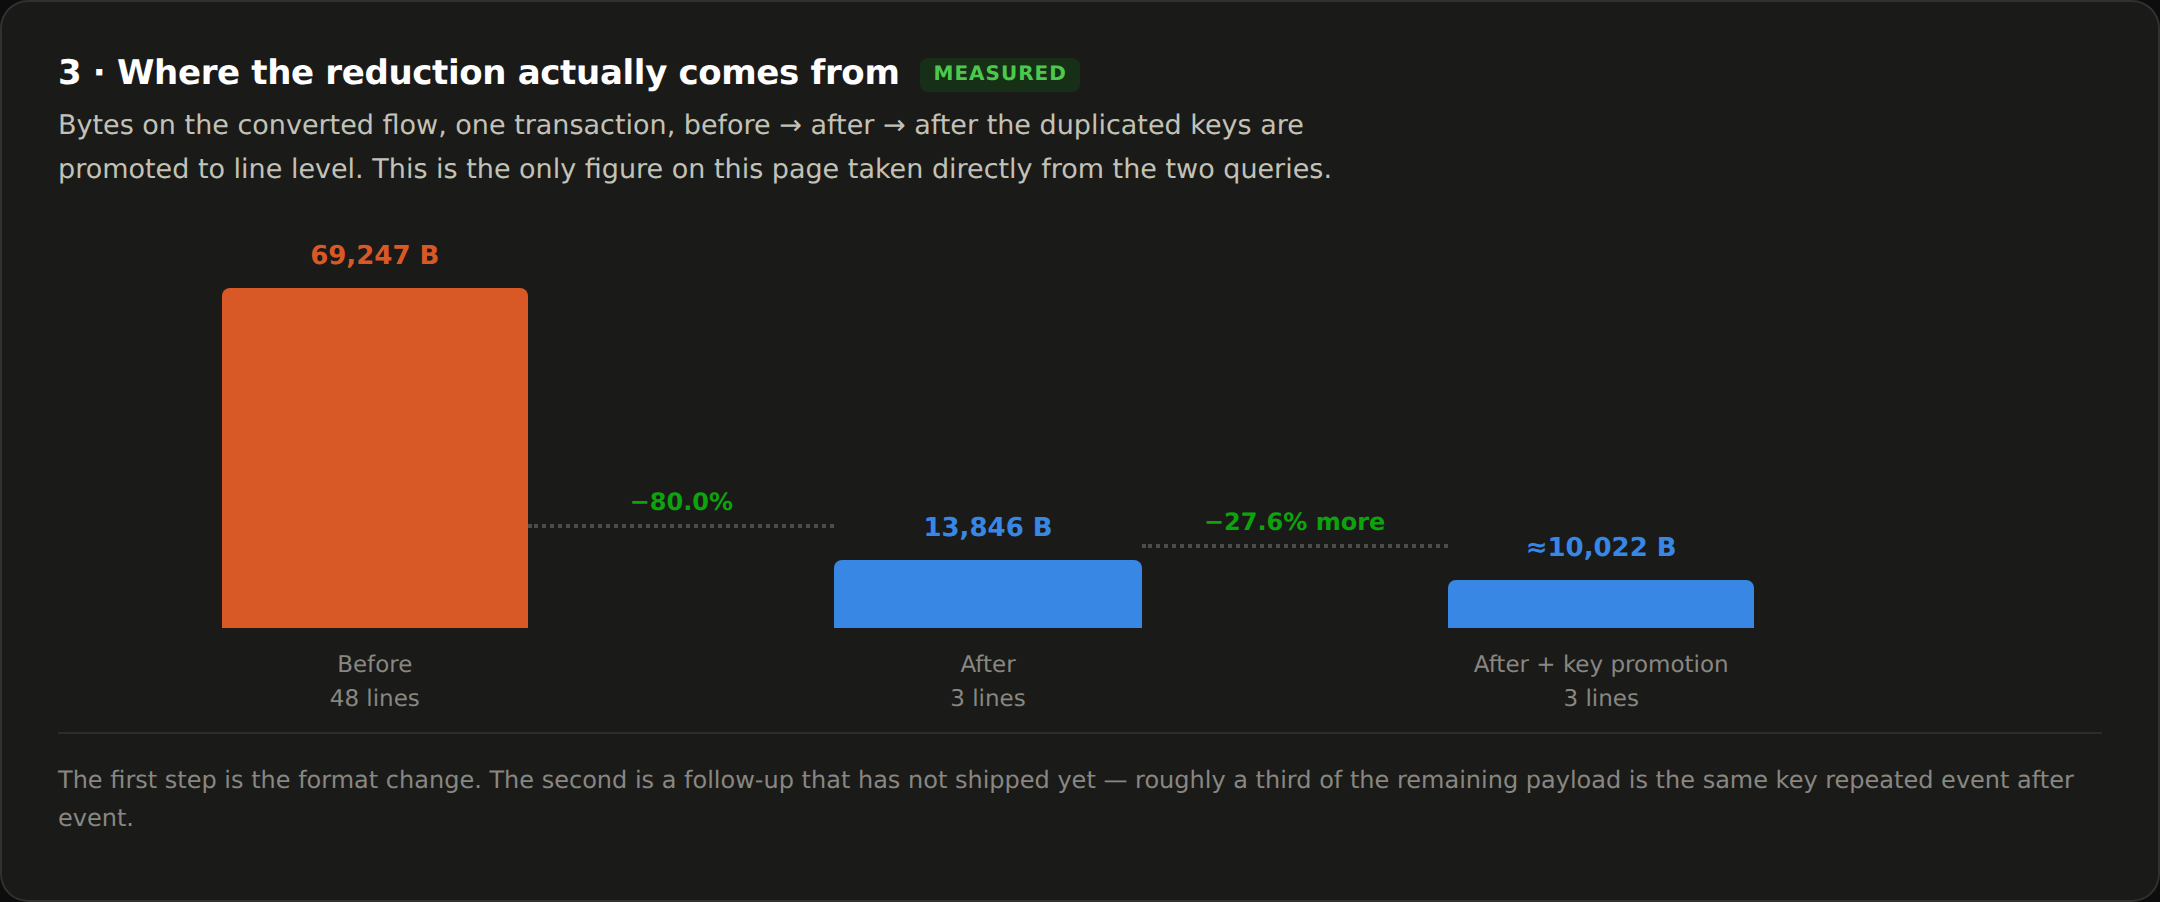
We did this conservatively — 48 lines became 47 events, so we barely pruned on the first pass. That was deliberate: change the shape first, prove nothing broke, prune second. Pruning is where the second 80% comes from, and it is far easier to argue about when you can see all 47 events sitting in one place.
6. Why three lines and not one
Three is not a magic number and it is not a best practice: it is what this example's domain produced. So there is no right number — every domain will have its own, and in many of them wide events will never be necessary at all.
A checkpoint is not a time interval, and it is not an event count. It is a stage of the business process, named in the language of the business. For a card flow that means things like: the request was received and understood; the authorization decision was made and registered; the result was persisted and returned. Those are the stages someone would actually use if you asked them what happened to a transaction. Nobody has ever answered that question with "the first 26 steps went fine."
Get the stages right and the number falls out by itself. Ours produced three. A capture with a settlement leg would produce four. A simple read produces one — and one is correct, that is the canonical form from the literature. If your unit of work has no meaningful internal stages, do not invent them to hit a number.
The test that keeps this honest: can you name the checkpoint without referring to the
code? OrderValidated and AuthorizationDecided mean something to a person who has never
opened the repository. Checkpoint2 and AfterServiceCall do not — and a checkpoint you
cannot name in domain language is one that will not survive the next refactor, because nothing
anchors it.
Once the stages come from the domain, four other things fall into place, which is usually the sign that a boundary is in the right place:
A dropped line costs one stage, not the story. Log loss under load is what starts most of these projects. If the whole narrative rides on one line, losing it makes the transaction invisible. Three disjoint slices means you lose a third and still know the flow existed and roughly where it stopped.
A flow that dies still leaves evidence. An event emitted at the end only exists if there is an end. Crash, timeout, or a poison message mid-parse, and a single-event design gives you silence for exactly the transactions you most need to see. With stages, you get everything up to the last flush — and the missing next one is itself the signal.
Domain stages usually coincide with ownership boundaries. These three stages happen to be the boundaries between the components that own them, and the flow crosses async boundaries between them. Each line comes from the component that produced it. That is not a coincidence — it is what well-drawn service boundaries look like when they work.
Lines have practical size limits. 47 events with their attributes in one payload is a large line, and plenty of pipelines truncate at a fixed size. A truncated wide event is worse than several intact ones, because you lose the tail silently.
The trade-off, stated plainly: three lines means paying the stamp three times instead of once, and reassembling the full flow means fetching three lines instead of one. That is a deal worth taking when durability under load is the reason you started.
7. Errors and warnings do not go in the blob
If a failure becomes one entry inside an Events array on a line stamped INFO, then every
severity-based alert stops firing, your error tracker sees nothing, the dashboard filtered to
level=error goes quiet, and the graph everyone trusts shows an improvement that is entirely
an artifact of your logging change. You will have driven your error rate to zero by making
errors unobservable.
Three rules fix it.
1. The line inherits the highest severity it carries. This is the important one, and it is
the whole trick. A checkpoint is not INFO by default — its severity is the maximum severity
of the events accumulated in it. One WARN event in the slice and the checkpoint line is
emitted at WARN. One error and it is emitted at ERROR.
flush(description, attrs = {}) {
  events = this.flushEvents()
  level  = greaterSeverity(events)
  attrs  = attrs << [
    EventCount: sizeOf(events),
    Events:     events
  ]

  log.onSeverity(this.cid, level, {
      Body:  description,
      Attrs: attrs
  })
}
Severity keeps meaning exactly what it meant before: is there something in here a human should look at? Every alert, filter and dashboard that keys off level keeps working without knowing anything about the new format — and that is what makes the change shippable without a coordinated migration of your alerting.
2. Errors are also emitted immediately, on their own line. Severity promotion is not enough on its own for errors, for two reasons: the stack trace belongs on a line of its own rather than stuffed into a description string, and an exception may prevent the flush from ever happening. So errors are written the moment they occur, exactly as before, and recorded into the accumulator so the narrative stays complete, with the failure in sequence and with its offset. Yes, the error then appears twice. That duplication is deliberate and cheap, because errors are rare — optimising the byte count of your error path is optimising the wrong thing.
3. Counts and outcome live at line level, not inside the payload.
{
  "Cid": "...",
  "Body": "AuthorizationDecided",
  "EventCount": 16,
  "ErrorCount": 0,
  "WarnCount": 1,
  "Outcome": "degraded",
  "StatusCode": 202,
  "Events": [ ... ]
}
This is what makes the interesting questions cheap to ask: which flows completed but carried a warning, what is the error rate by stage, which clients see degraded outcomes. All filters on a field, with no JSON parsing in the query path.
And one thing that is easy to miss: flush on the way out of a failure. If an exception
escapes before the next checkpoint, emit what you have and mark it a partial slice. The
accumulated events are most valuable precisely when the flow did not finish, and a finally
that flushes is the difference between having that story and losing it.
8. What it looks like afterwards
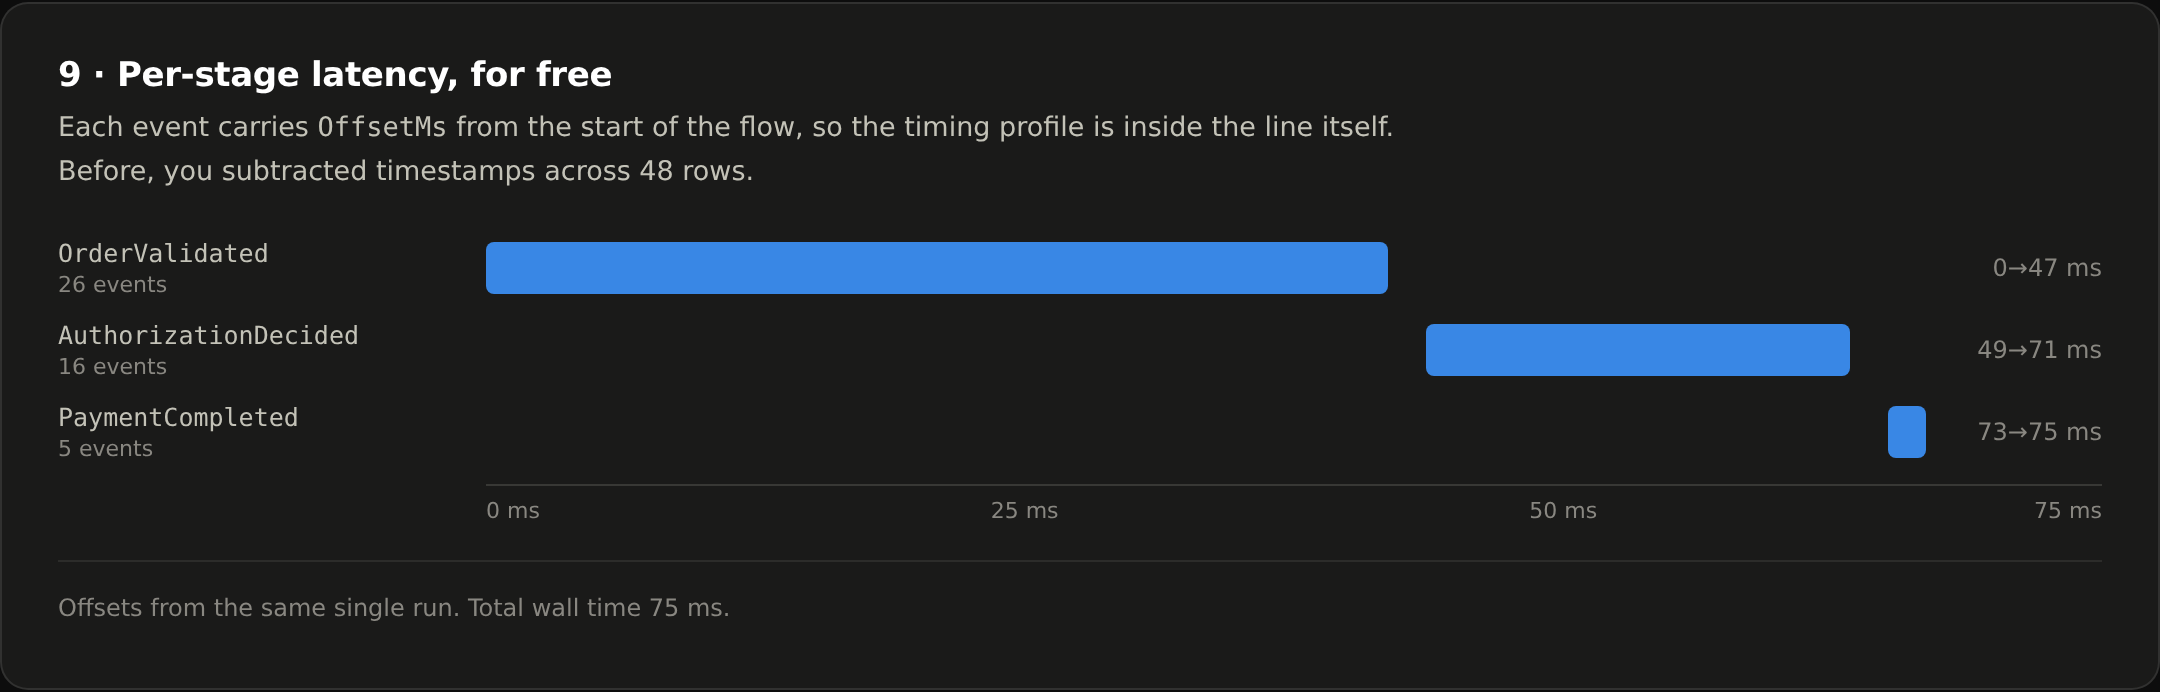
Three lines. The summary is the default view:
OrderValidated        · OrderService          · EventCount 26 · 0→47 ms
AuthorizationDecided  · AuthorizationService  · EventCount 16 · 49→71 ms
PaymentCompleted      · PaymentHandler        · EventCount  5 · 73→75 ms · 202
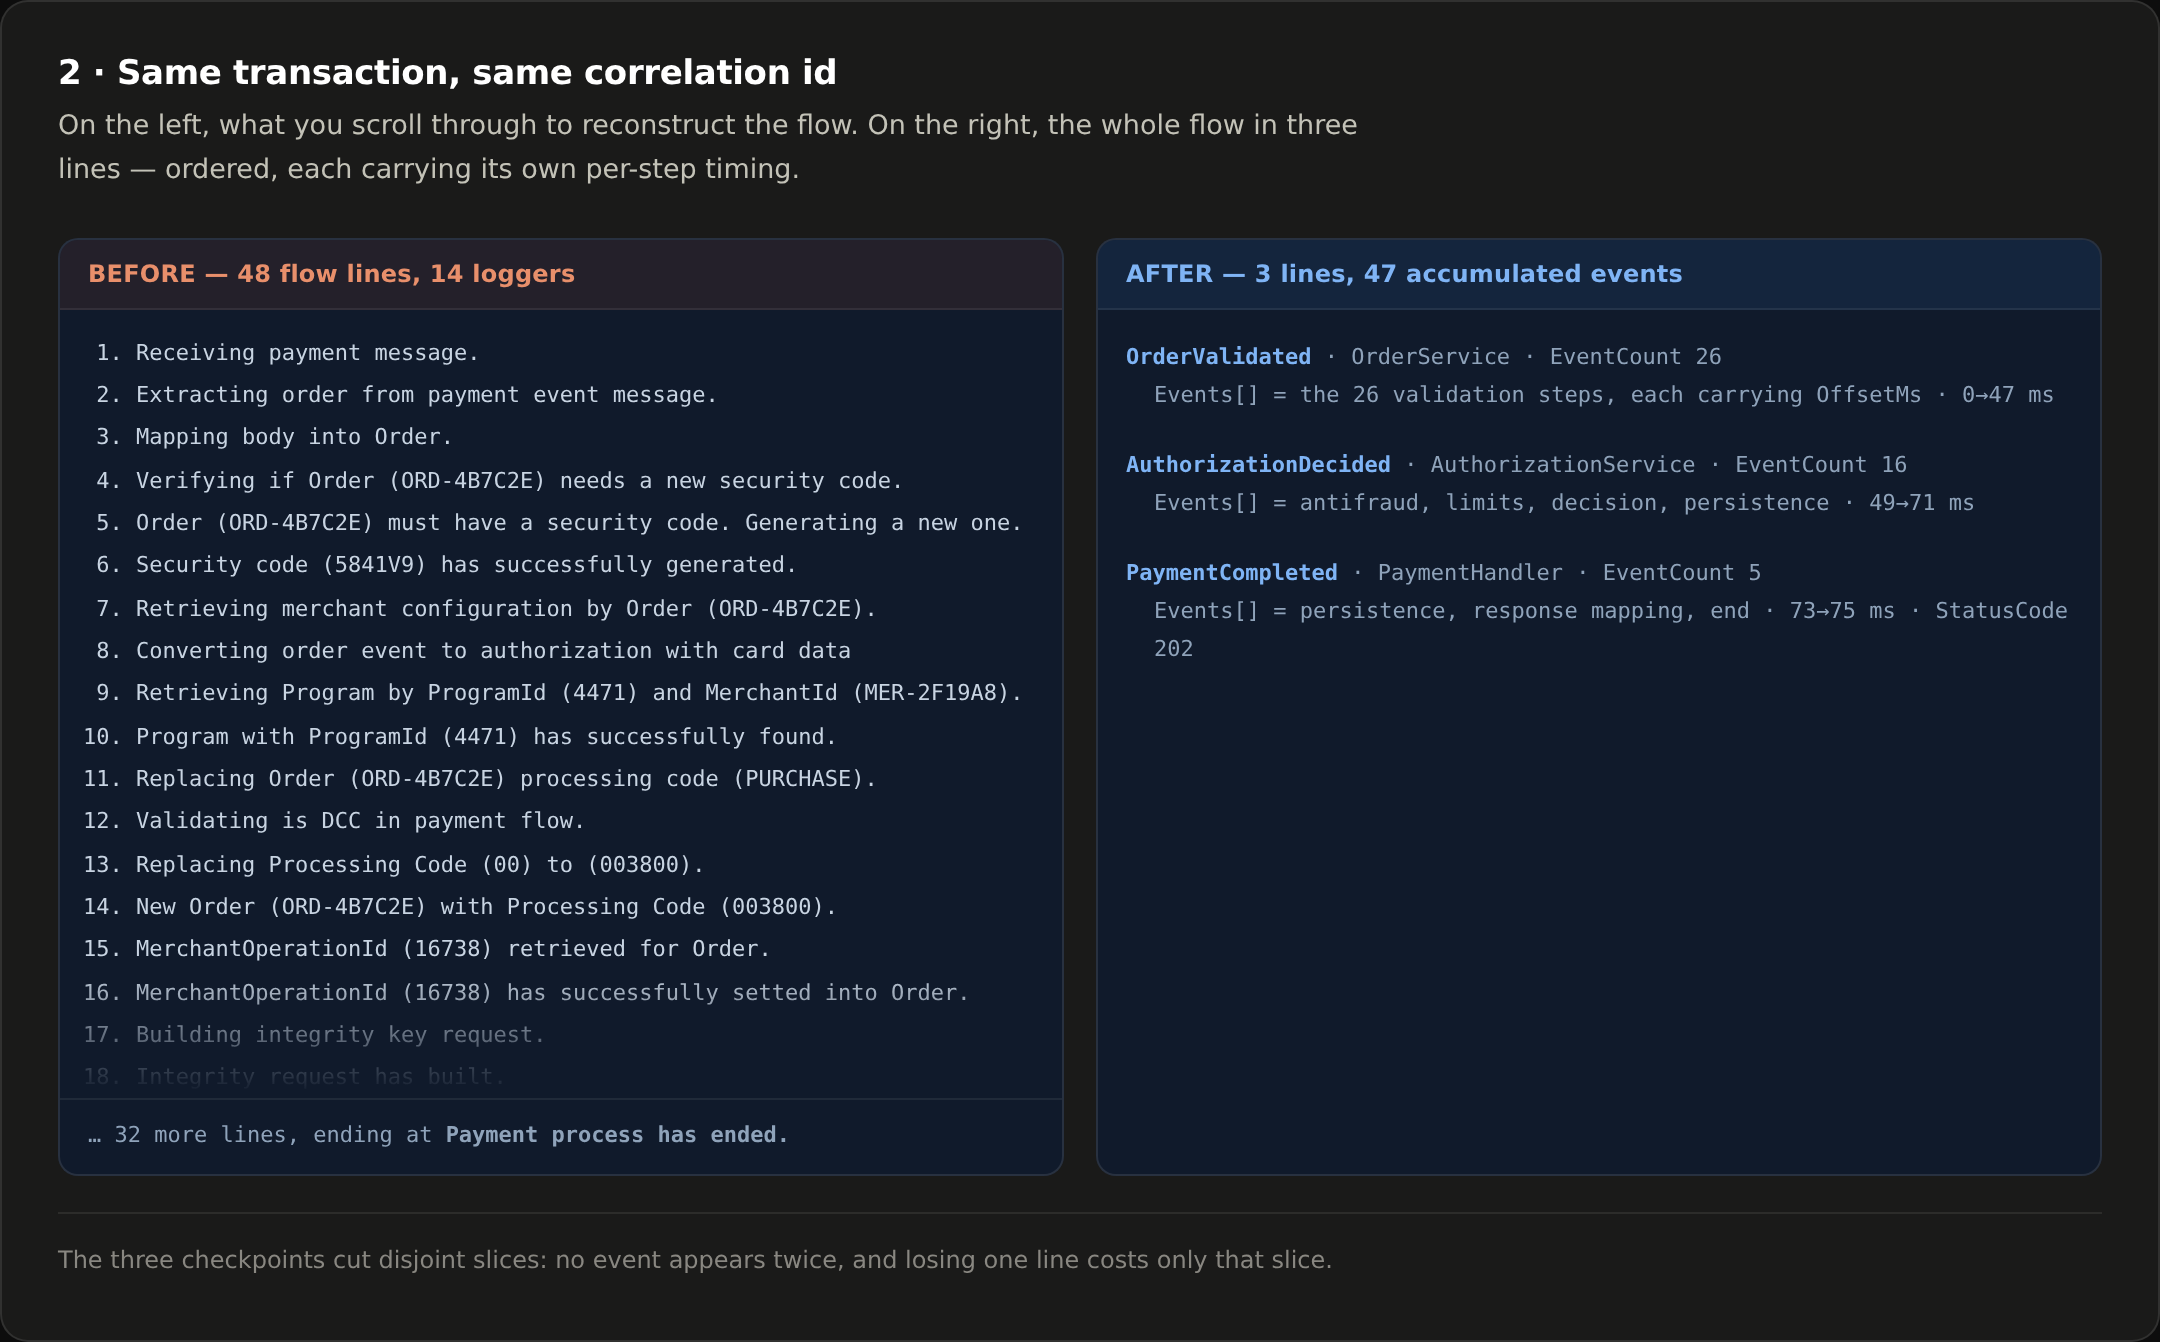
And the step-by-step is one click away:
{
  "Cid": "pay-7f3a91c4-2e58-4b10-9d07-c6ae5f0d2311",
  "Body": "OrderValidated",
  "EventCount": 26,
  "Events": [
    { "Description": "PaymentReceived", "OffsetMs": 0, "Attributes": { "Ingress": "sqs" } },
    { "Description": "Mapping body into Order.", "OffsetMs": 0 },
    { "Description": "Performing antifraud evaluation.", "OffsetMs": 10,
      "Attributes": { "AuthorizationId": "AUTH-8D31C2", "MerchantId": "MER-2F19A8" } }
  ]
}
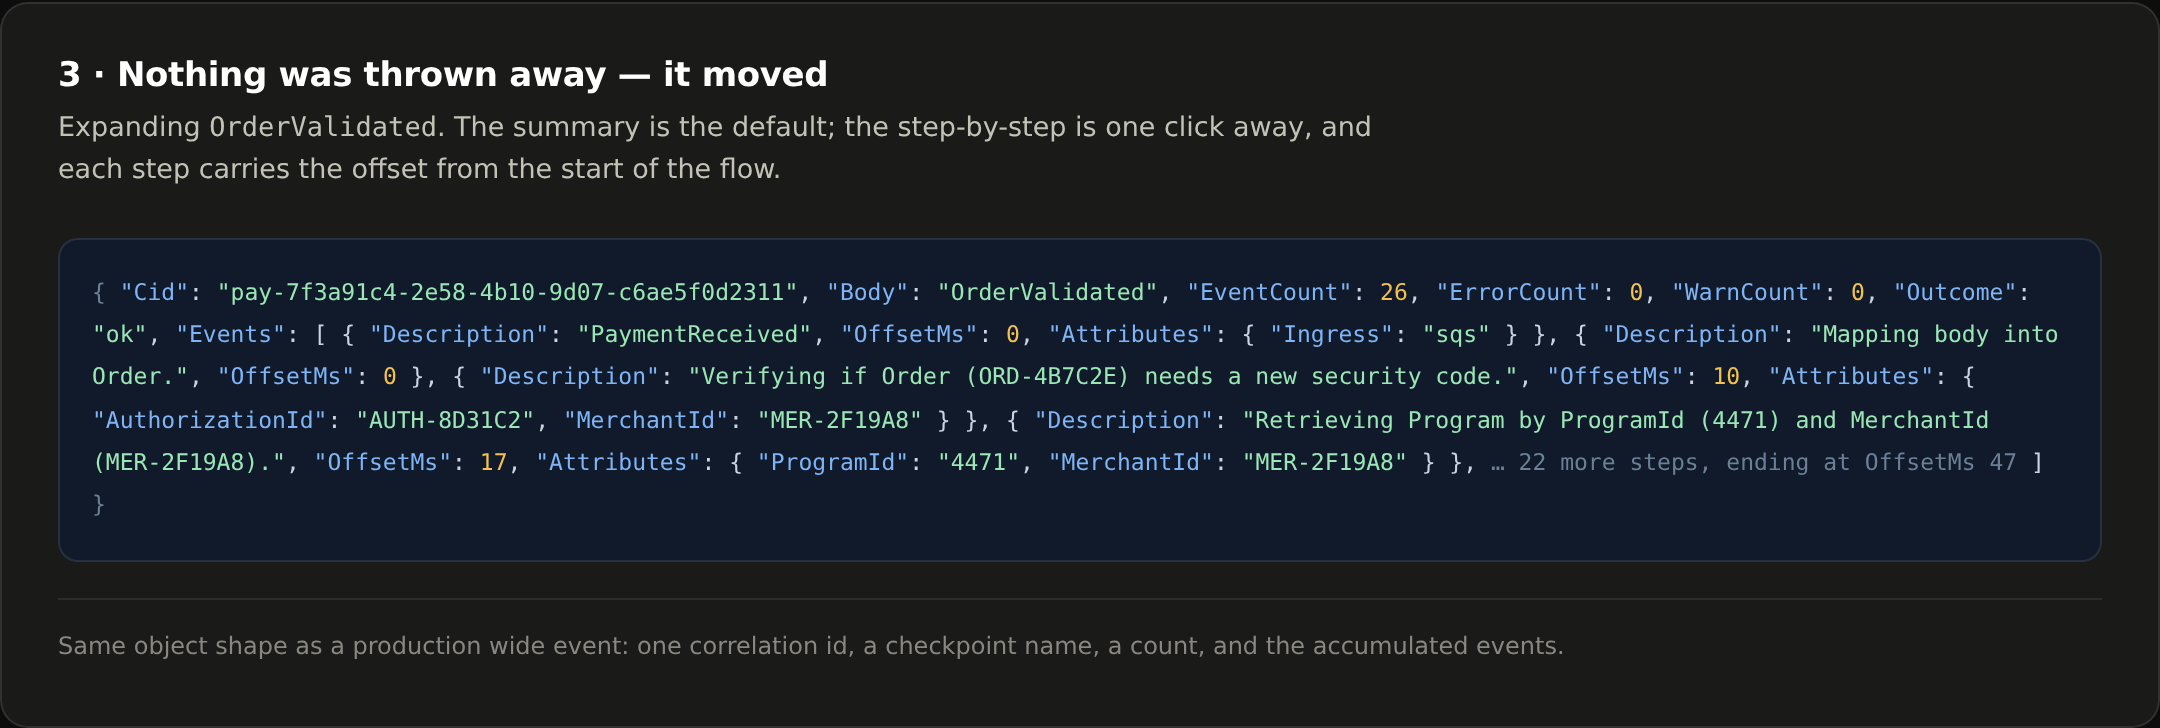
Nothing was deleted. It moved. 47 business events are still recorded, now carried by 3 lines instead of 48 — and each one arrives with its own offset, so the latency profile of the flow is inside the line. Before, you got that by subtracting timestamps across 48 rows.
9. Numbers
Methodology first, because it bounds what these numbers mean. One transaction, measured end to end, in a pre-production environment, before and after the change. Byte counts are UTF-8 over the raw log line. This is an indication of order of magnitude, not a production average, and your system is not the system measured here.

| Metric | Before | After | Δ |
|---|---|---|---|
| Total lines | 53 | 7 | −86.8% |
| Lines — payment flow | 48 | 3 | −93.8% |
| Lines — other logs | 5 | 4 | unchanged |
| Total bytes | 72,871 | 17,035 | −76.6% |
| Bytes — payment flow | 69,247 | 13,846 | −80.0% |
| Bytes per line (mean) | 1,374 | 2,433 | +77% |
| Business events recorded | 48 lines | 47 events | preserved |
| Bytes scanned by the query | 2.19 MB | 240 kB | −89.0% |
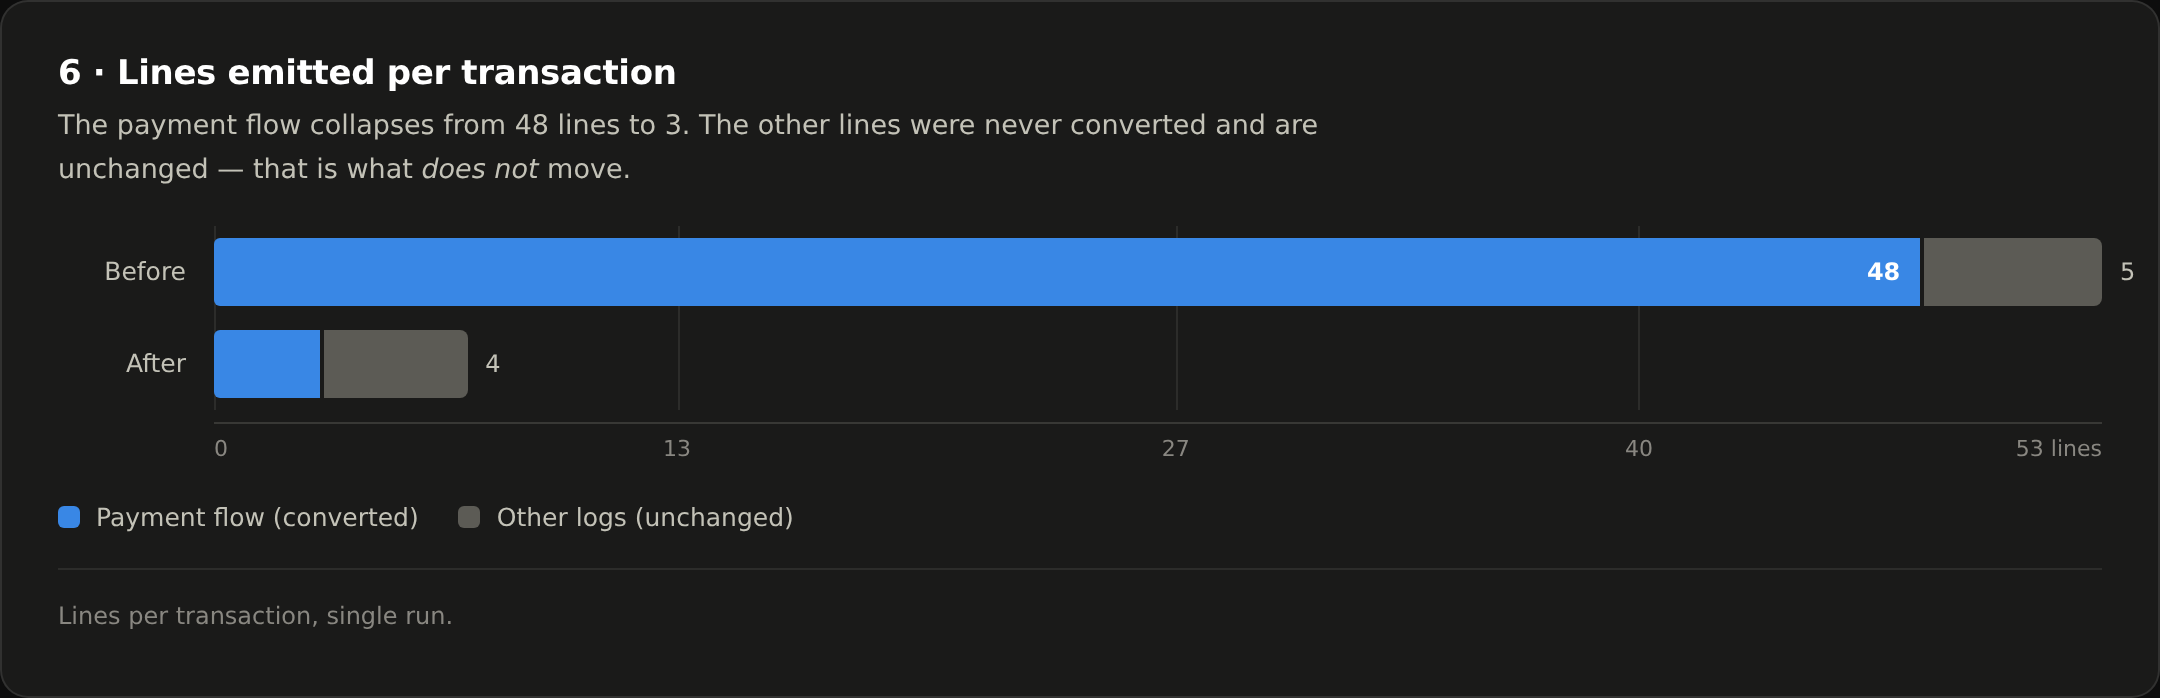
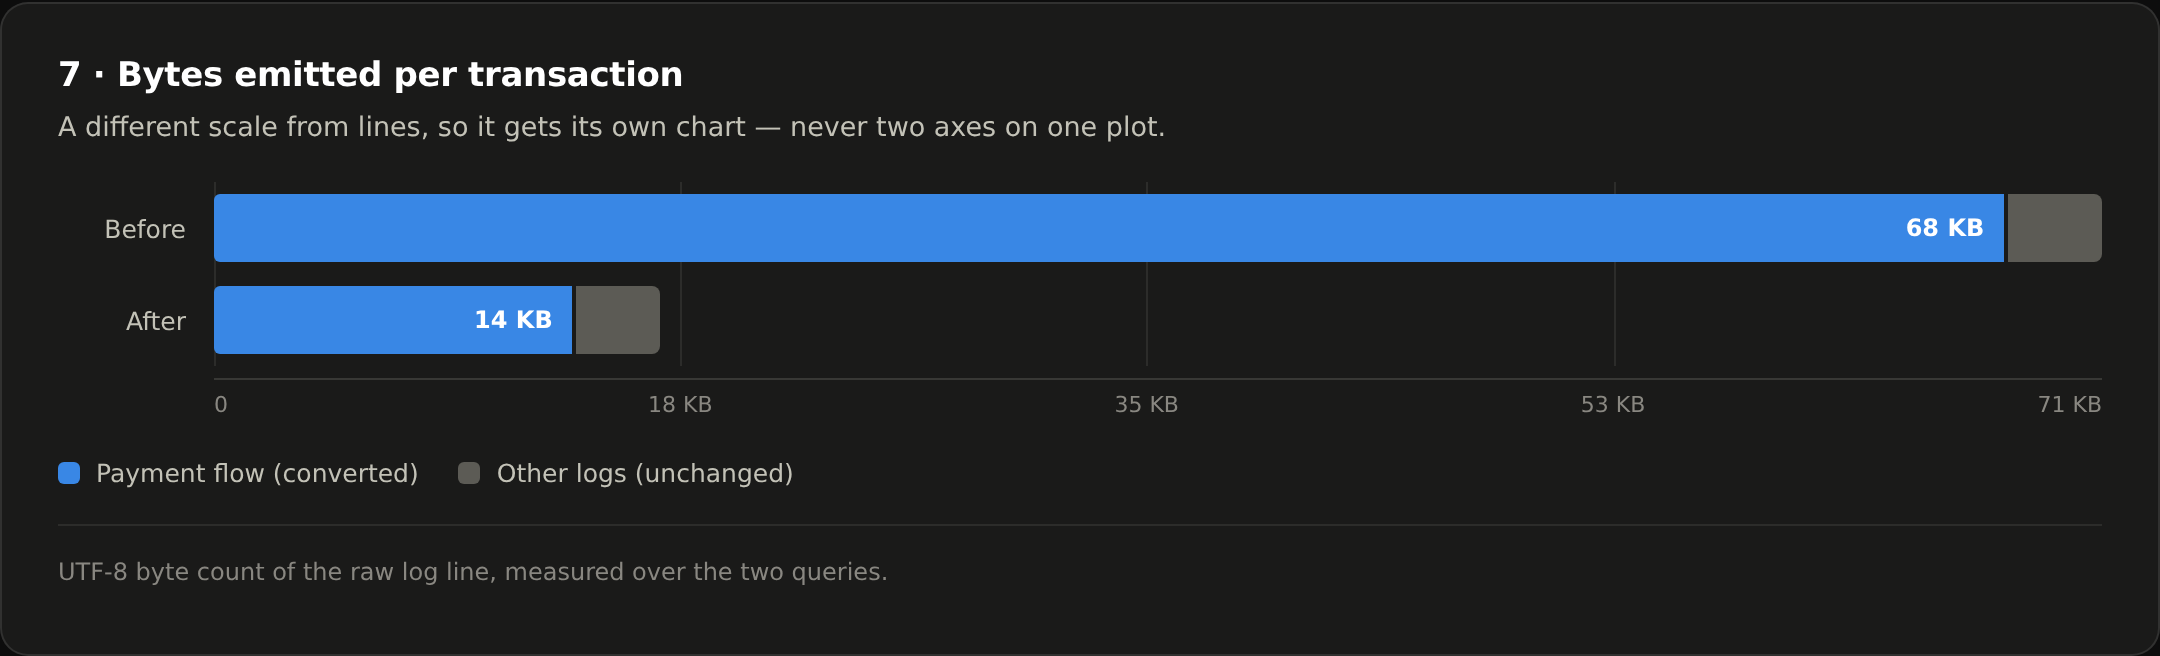
Two rows deserve comment.
Bytes per line went up 77%. That is not a side effect, it is the mechanism. One line now carries a whole slice of the flow. If that number had not gone up, the change would not have worked.
Lines that were not converted did not move. Five other log lines were in the same window and stayed exactly as they were. It is worth showing what doesn't change — before/after numbers that improve uniformly are usually measuring something other than what they claim.
10. What is still on the table
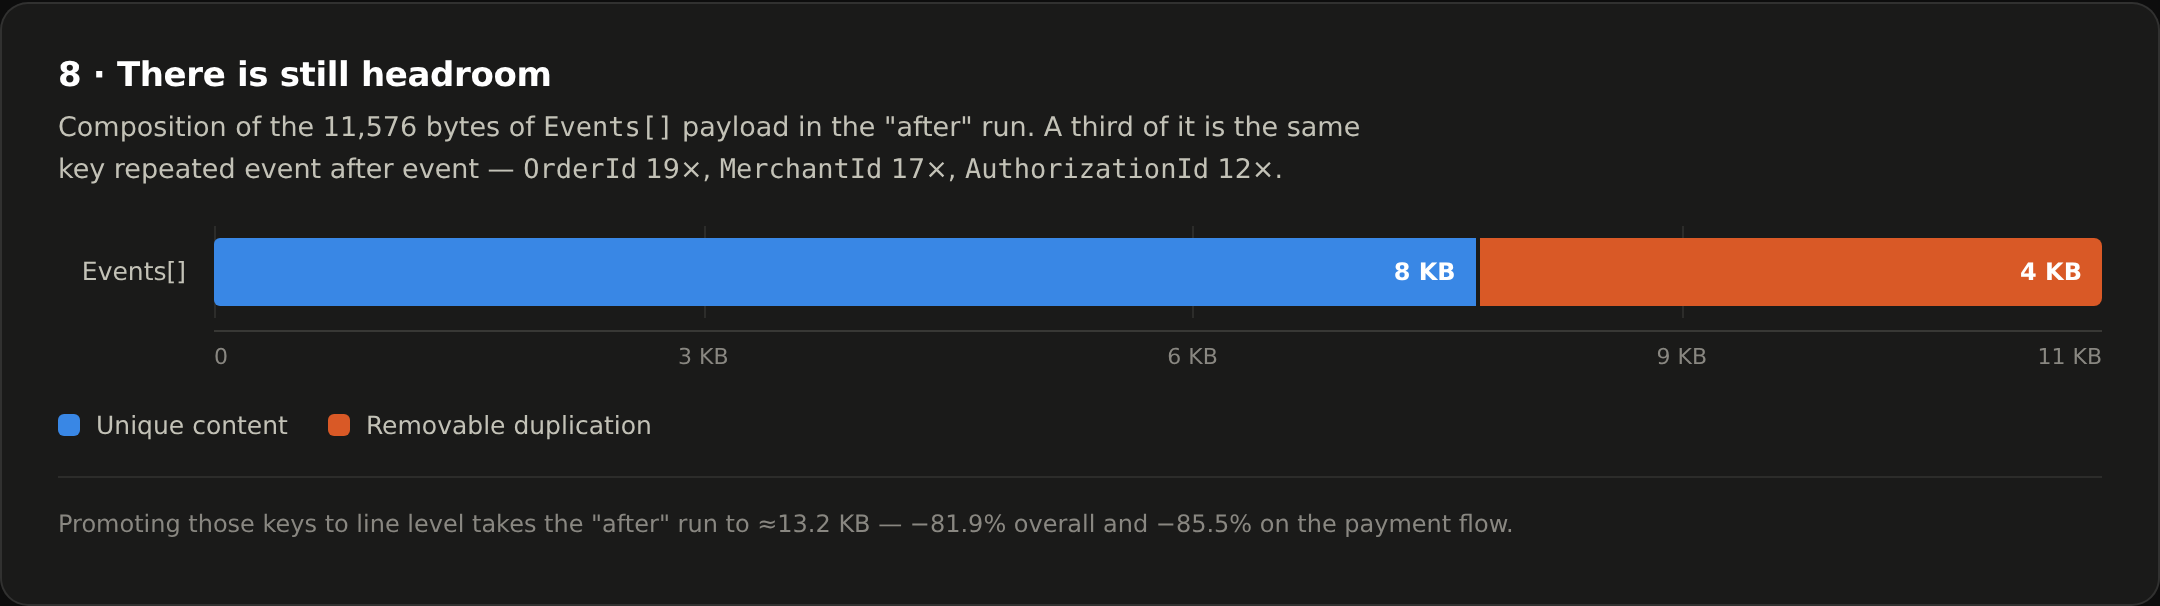
We measured the composition of the resulting payload, and roughly a third of it is the same
key repeated event after event within a single line: OrderId 19 times, MerchantId 17
times, AuthorizationId 12 times.
Those are properties of the flow, not of individual steps. Promoting them to line level projects to ≈13.2 KB — −81.9% overall, −85.5% on the flow itself.
The general rule that falls out: an attribute that is constant for the whole unit of work belongs on the line, not on the event. We got that wrong the first time, mechanically translating each existing log line into an event with the attributes it happened to carry.
11. When not to do this
Long-running and streaming work. A wide event is emitted when a slice completes. If your unit of work is a six-hour batch job or an open WebSocket, you have no telemetry until it finishes, and none at all if it never does. Checkpoints soften this; they do not solve it. Laban Eilers, writing from SimpliSafe's production experience, is blunt that long-running spans are broadly an unsolved problem.
Debugging inside a single step. A wide event is a summary, and summaries lose sequence. It will tell you the persistence stage took 22 ms; it will not tell you which branch the handler took. Cross-request questions are what this format is good at. Intra-request causality still wants spans or plain debug logs. Anyone telling you to delete all your logs is overselling.
Backends that punish high cardinality. Everything here assumes you can query on fields with many distinct values. If your store indexes on low-cardinality labels and brute-forces the rest, you will feel it.
Schema drift. Wide events accumulate fields over years the way log lines accumulate lines. The failure mode is deferred, not avoided.
Systems that already log five lines per request. You do not have this problem. Go do something else.
The gains here are specific to one system, and there is no guarantee they transfer. But if your logs serve as an audit trail — payments, ledgers, anything a regulator or a dispute process might read — then legibility is not cosmetic. It is the difference between reconstructing an incident in two minutes and reconstructing it in forty.
12. Isn't this just a span?
It is the same instinct, and the honest answer is that the ideas overlap heavily.
A wide event is close to what you get from a well-attributed root span. If you already run OpenTelemetry end to end and your backend queries span attributes comfortably, put these fields on the span and stop reading.
The reason to do it in the log stream: in systems like this, logs are the durable, queryable audit record. They are retained on a different schedule than traces, read by people who do not use the tracing UI, and referenced in processes that have nothing to do with engineering. Moving the narrative out of that stream would have solved a readability problem by creating an access problem.
The two are complementary rather than competing. Traces answer where in the topology; wide events answer what happened to this unit of work.
13. Where the idea comes from
None of this is new, and it is worth reading the people who got there first:
- Brandur Leach, Using Canonical Log Lines for Online Visibility (2016) — the original write-up, and still the clearest.
- Stripe, Fast and flexible observability with canonical log lines (2019).
- Jeremy Morrell, A Practitioner's Guide to Wide Events (2024) — the most complete guide to what belongs on the event.
- Ivan Burmistrov, All you need is Wide Events, not "Metrics, Logs and Traces" (2024) — the strong form of the argument.
- Abraham et al., Scuba: Diving into Data at Facebook (2013) — the systems paper underneath all of it.
14. How to start
One service. One flow. Three checkpoints.
Measure before you change anything — lines and bytes per unit of work, and the bytes your usual query scans. Without a baseline you will have an opinion instead of a result.
Keep the original message strings verbatim so nothing downstream breaks. Ship it behind a flag, run both for a week, compare.
Then ask the question that started all this, about whatever else is currently on fire:
Are we solving it, or are we paying to avoid solving it?
Sometimes paying is genuinely the right answer. It is just worth knowing which one you picked.
Appendix — what this looks like at scale
Everything in this appendix is a model, not a measurement. It takes the per-transaction byte counts measured above and multiplies them by a traffic assumption. It shows the shape of the saving, not a promise — your line counts, line sizes, throughput and pricing are all different.
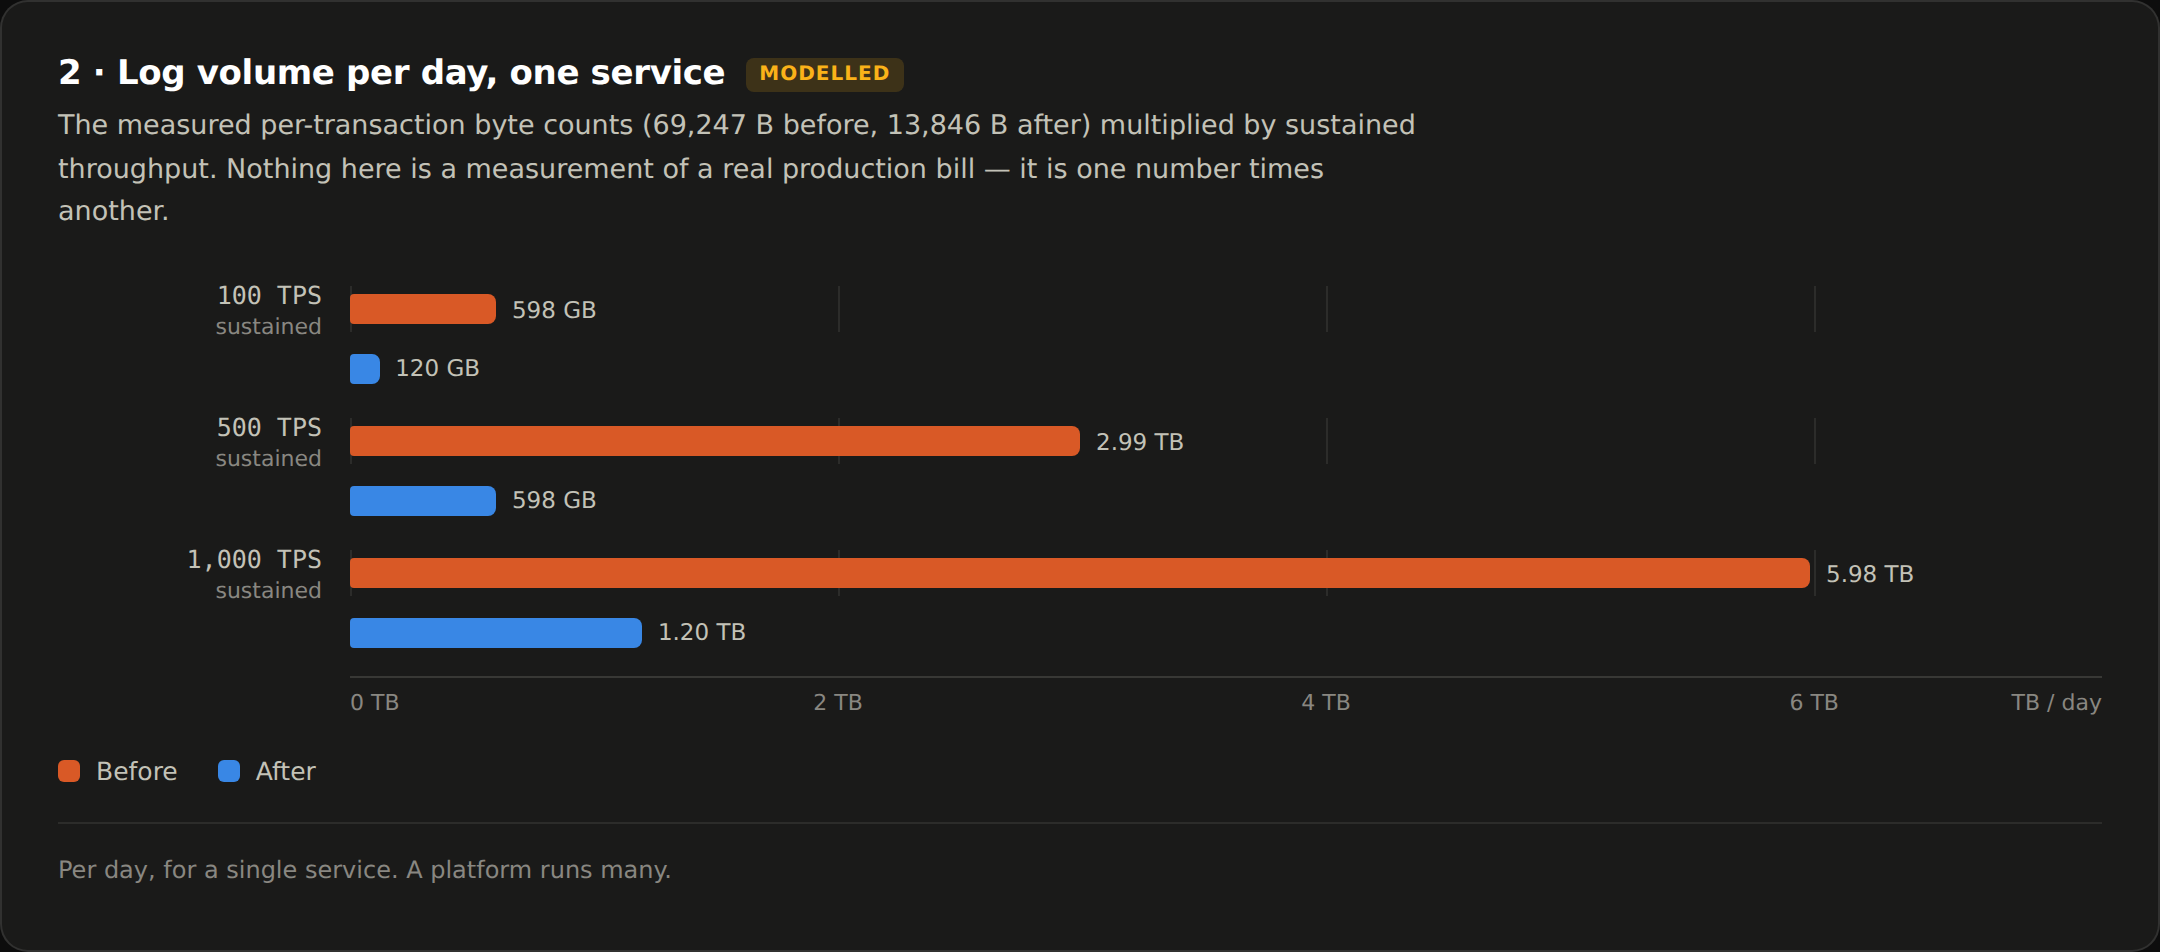
There is no honest way to publish a dollar figure that applies to your platform: ingestion pricing varies by an order of magnitude across vendors, tiers and commitments. So here is the same arithmetic with the rate left as your input.
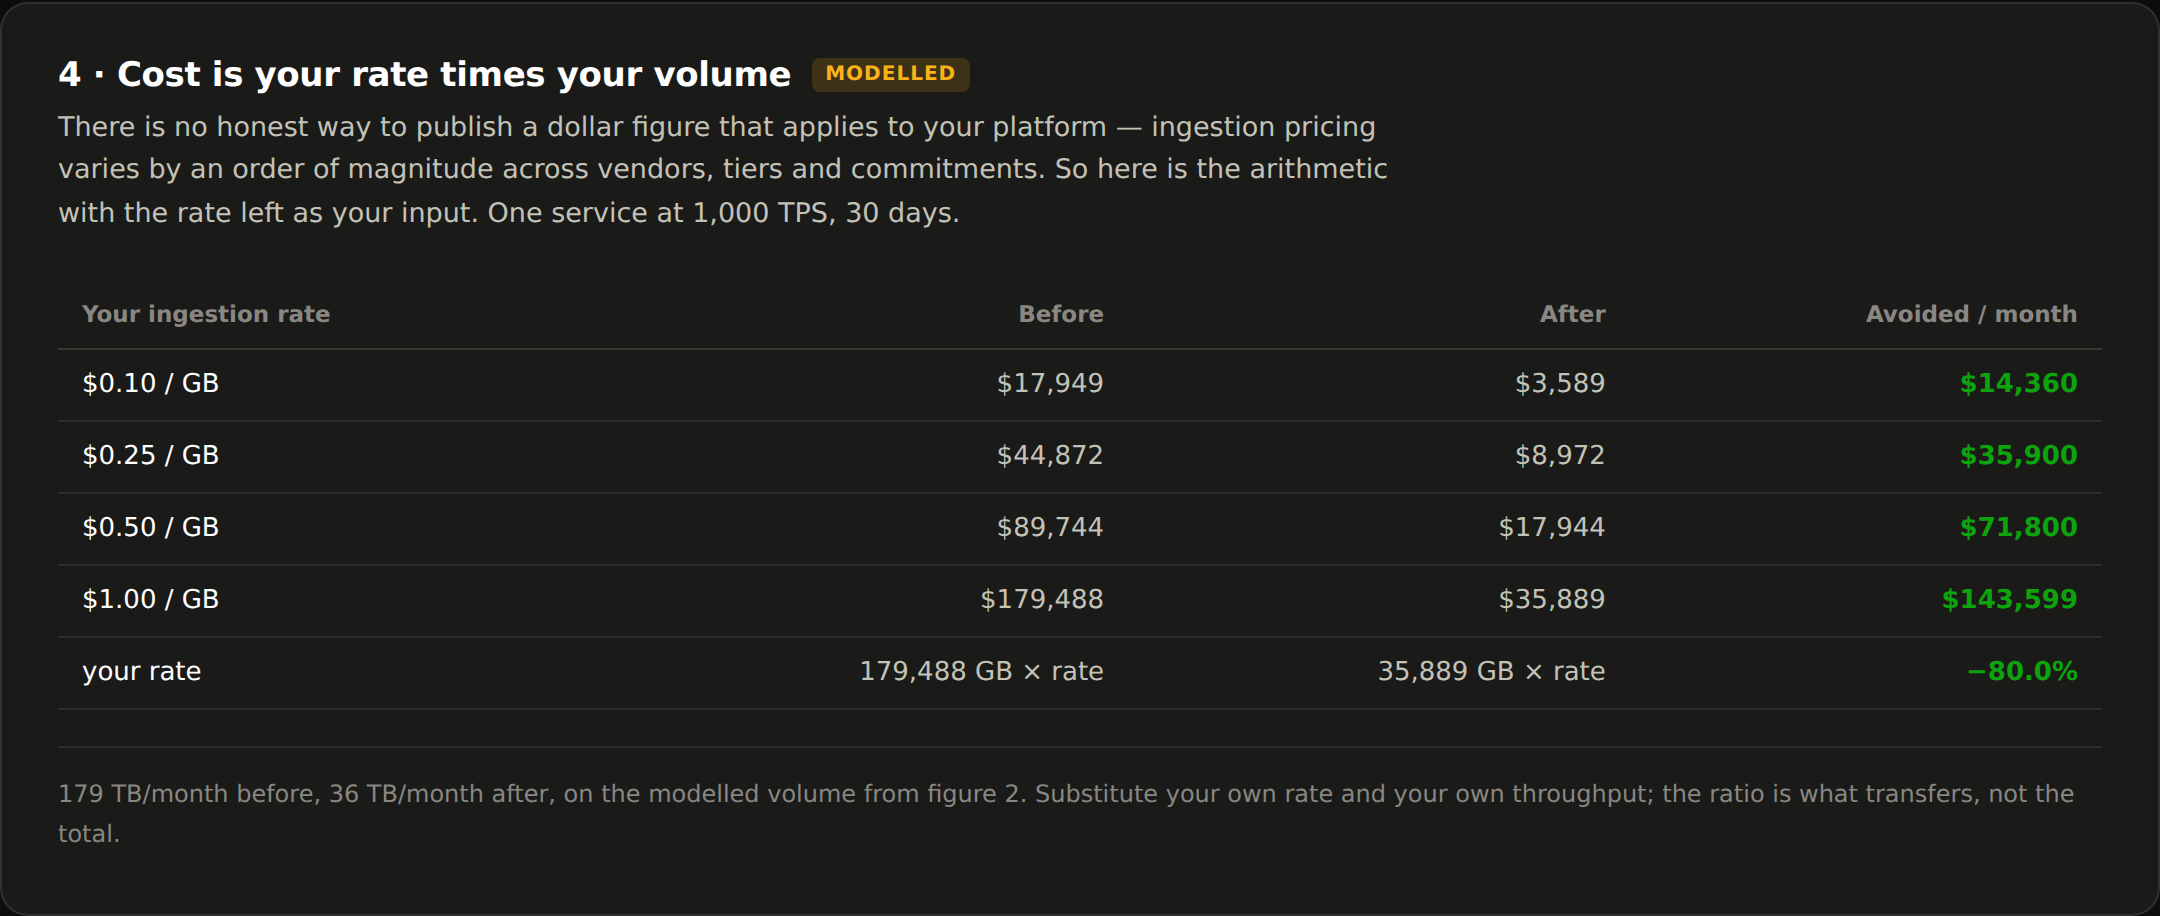
The ratio is what transfers. The total is not.